

(Solve the EquationSolve the Equation | Art by Lie Setiawan)
By Ties Westendorp (Knaapje)
"Mana Screwed Again! What Are the Odds?"
It's a simple question, one that's bound to have popped up in your mind whether you're an experienced Magic: the Gathering player or just starting out. A simple question, but finding the answer is perhaps not so easy. How would we go about actually calculating these odds?
There are a few possible solutions imaginable, so to start, let’s take a look at the simplest one. *Takes a deep breath.* Assume that about a third of your deck are land cards, that you’re never going to mulligan, that you’re the starting player and so not getting an extra card on your first turn, and that you want to have at least three mana by turn three by simply playing a land each turn. *Pants heavily.* In this case, if we assume that each subsequent card is equally likely to be a land, we can use the binomial distribution to arrive at a probability of about 62%. Not too bad.
However, several things should be bothering you about this method. The main two interrelated points are probably that we didn’t take the actual deck size into account anywhere, and that in reality not every card is equally likely to be a land; subsequent card draws are not independent statistical events. Every land card we draw is going to make the next card less likely to be a land, and vice versa.
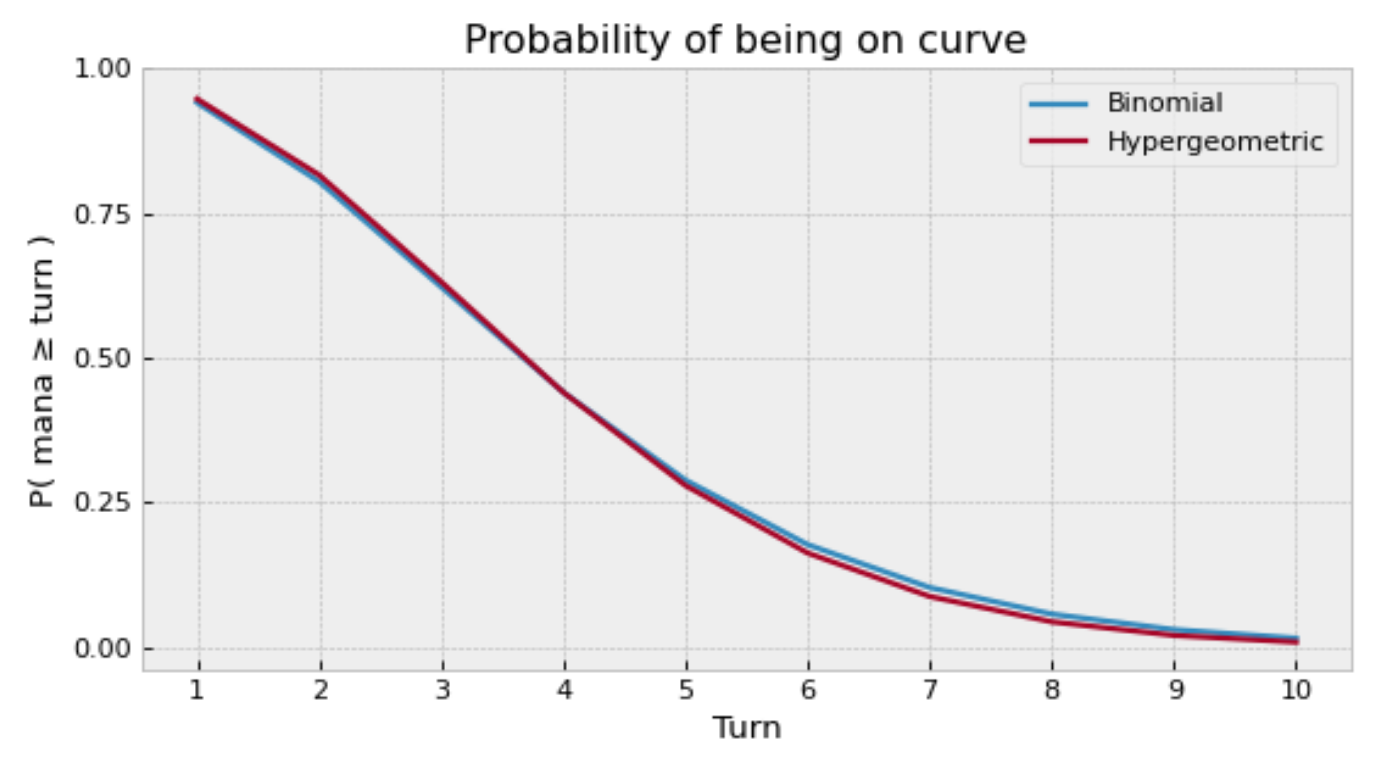
This is where the cryptically named hypergeometric distribution comes in - the go-to analysis tool of any self-respecting Magic: the Gathering player looking to up their game. Where the binomial distribution tells us the probability of getting a specific number of successes “with replacement” (i.e., equivalent with shuffling your deck, revealing the top card, noting whether it’s a land or not, then shuffling again and repeating), the hypergeometric distribution takes into account that card draws are, in fact, not independent (i.e., telling us the probability of getting a specific number of successes without replacement, where cards aren’t reinserted into the deck after being counted as a “success” or not). This also means that we now additionally need to specify the deck size, resolving the two earlier objections.
Using the same example as before, and assuming our deck consists of 99 cards, with a third of them being lands, we get a slightly higher probability of about 63%, which is a step closer to the truth. This graph should indicate that you probably want to play more than 33 lands in your Commander deck.
But what about the other assumptions we made earlier? What if we want to allow for mulligans, card draw, mana rocks, searching our library for lands (or cards in general), playing multiple lands per turn, et cetera? Just as before, extending the model requires us to specify additional input data. In this case, it requires us to somehow model the effect of these different abilities and to define player strategy. (In fact, we’ve so far already implicitly assumed some rudimentary player strategy: namely that if we can play a land, we do so.) If we're to account for all these different factors, it’s going to be practically impossible to get an analytical answer, i.e., an answer in the form of a neat little formula like the distribution function of the binomial or hypergeometric distribution. Resorting to physical experimentation isn’t really an option either, as it’s very cumbersome to have to track your actual games to get results, and you’re realistically never going to achieve a desirable level of accuracy. If we want to do any better, we’re going to need numerical tools.
The tool I’m creating to tackle this (written in Python) is what’s known as a Monte Carlo simulation. It uses a simplified model of the rules of Magic to perform a large number of playthroughs, each starting with a randomly shuffled deck, while recording whether we’re on or ahead of curve on each turn in each playthrough. The law of large numbers tells us that if our model of Magic is correct, then repeating this experiment often enough would make the sample average tend towards the true probability of being on curve.
Since I’ve used a simplified model that doesn’t cover all rules of Magic, all this is really a further refinement of the model we're using to approximate the true probability of being on curve. Indeed, if we feed it a deck consisting of just untapped lands and “filler cards” (unplayable cards with no effects), using a “see-land-play-land” AI, we get results that are hypergeometrically distributed as expected. In that sense, the Monte Carlo simulation generalizes/extends our previous model. Whereas the previous model could only describe a combination of untapped and filler cards, this new tool can (so far) simulate:
- Cards that immediately, as well as in subsequent turns (according to a pattern):
- Add mana
- Draw cards
- Create Gold/Treasure tokens
- Playing a single land and an arbitrary number of non-lands per turn
- Player agent strategies with regards to:
- Taking mulligans
- Choosing which cards to play
- Discarding cards at the end of turn
With these effects alone we can model a lot of cards of interest. Among others, cards like Bounty of the Luxa[/e], [el]Phyrexian ArenaBounty of the Luxa[/e], [el]Phyrexian Arena and Smothering TitheSmothering Tithe can be modeled (assuming a specific number of players don’t pay the Smothering TitheSmothering Tithe tax each turn).
The graph below shows exactly that - it shows the effect of replacing a “filler card” with one of these cards in a deck that consists of 38 untapped lands and 61 filler cards. The "38 lands with filler deck" acts as baseline and follows the hypergeometric distribution. We can see that Phyrexian ArenaPhyrexian Arena and Bounty of the LuxaBounty of the Luxa both approximately have the same effect (in terms of probability) of being on-curve when added to this deck, while Smothering TitheSmothering Tithe outperforms them both. Only turns 4 through 10 are plotted, since the results only start to diverge from the fourth turn onward, due to the mana value of these cards.

It’s pretty cool to see that just one card can have such a big impact!
So what about something that looks a bit more like an actual deck? Let’s consider a deck of 20 untapped lands and 18 tapped lands, and 61 filler cards, and three variations of it where we’ve replaced a number of filler cards by either a “ramp package”, a “draw package”, or both. For this simulation, I’ve used the following packages:
Ramp Package (13)
- 1 Birds of ParadiseBirds of Paradise
- 1 Llanowar ElvesLlanowar Elves
- 1 Fyndhorn ElvesFyndhorn Elves
- 1 Elvish MysticElvish Mystic
- 1 Azorius SignetAzorius Signet
- 1 Gruul SignetGruul Signet
- 1 Selesnya SignetSelesnya Signet
- 1 Simic SignetSimic Signet
- 1 Azorius LocketAzorius Locket
- 1 Gruul LocketGruul Locket
- 1 Selesnya LocketSelesnya Locket
- 1 Simic LocketSimic Locket
- 1 Smothering TitheSmothering Tithe
Draw Package (6)
- 1 Gitaxian ProbeGitaxian Probe
- 1 Arcum’s AstrolabeArcum’s Astrolabe
- 1 Sign in BloodSign in Blood
- 1 DivinationDivination
- 1 Syphon MindSyphon Mind
- 1 Phyrexian ArenaPhyrexian Arena
Unsurprisingly, it turns out that this makes a huge difference. Having both ramp and card draw really adds to the playability of your deck, and they seem to complement each other, as seen in the graph below. These results make you doubt the usefulness of ever having used the hypergeometric distribution in the first place! What’s more, it seems that in the case of having both ramp and card draw, the probability of being on curve in turn 5 is actually higher than in turn 2 due to the prevalence of tapped lands. We’re already seeing interesting emergent behaviour that we wouldn’t ever see using simpler statistical tools.

So, how does it work? We’re not actually modeling the full game, which would require us to account for summoning sickness, triggered abilities every turn, turn sequence... yeah, we'd need a very complicated AI to handle all of that.
Instead, only some aspects are modeled, such as the gaining of mana, drawing of cards, and creation of Gold/Treasure, which are simulated as happening according to predefined sequences, consisting of finite prefixes followed by repeated patterns. Since Phyrexian ArenaPhyrexian Arena doesn’t immediately draw a card, but does do so every subsequent turn, it has a card draw sequence of: 0,1 (the underlined part indicates the repeating pattern). A card like DivinationDivination would be the other way around with 2,0, while Bounty of the LuxaBounty of the Luxa also has a sequence of 0, 1. Similarly, Llanowar ElvesLlanowar Elves would have a mana sequence of 0,1, while Dark RitualDark Ritual would have 3,0, and Smothering TitheSmothering Tithe could have a Gold/Treasure sequence of 0,1, assuming one player consistently doesn’t pay the tax.
In addition to these sequences, cards can have a cost or be a land. A player agent then is allowed to choose which cards to play in numerical experiments that span a given number of turns and are repeated a specified number of times. For the figure above, I’ve used the “naive AI”, which never mulligans, randomly plays cards as long as it can, and discards the first couple of cards in its hand if it needs to, due to hand limit. During each turn, the maximum amount of mana that could be generated is logged. Metrics can be applied to the logged data, allowing us to compute the probability of being on curve, but also the probability of being ahead of the curve, or the mean, median or mode mana across turns.
Below is another plot using the same deck, but using a slightly more sophisticated agent, which mulligans if it has less than three lands, up to a minimum hand size of five, and prioritizes cards to play as follows: 1) untapped land if it would enable playing other cards, 2) ramp, 3) card draw, and 4) randomly picking a card from among the remaining playable cards. It performs slightly better than the naive one.

While this captures a lot of relevant mechanics for our purposes, a lot is missed as well. Probably the only way to really capture all possible interactions would be to write an AI on top of an existing Magic client, which is bound to open a can of worms due to higher complexity and significant increase in runtime compared to the current setup.
Thus, since we don’t fully model Magic, there are some limitations to what can be done with the tool. Foremost of these is the fact that only the amount of available mana is tracked, not the actual color. Secondly, most repeated card draw effects are board state related and can not currently be modeled (e.g., SkullclampSkullclamp, Mentor of the MeekMentor of the Meek or Soul of the HarvestSoul of the Harvest).
Given the initial intention and scope of the project, these are unlikely to be easy or at all possible to implement in the future. The things I do still intend to implement are:
- Searching the library for cards
- Allowing playing multiple lands per turn according to a sequence
- Playing cards from other zones
- Scrying and surveilling
- Assessing the playability of a deck (e.g. “what is the expected delay between drawing a card and first being able to play it?”, “how much mana were we able to spend on non-ramp, non-draw spells?”, or any other possible metric for playability)
Right now every card still has to be manually modeled in order for the tool to be able to simulate it. Ultimately, I intend to reduce the barrier to use, by creating a tool that you can simply point at a text file or a web address, resulting in the graphs seen above.
If you want to check out the tool, you can find it on [PyPi] or [Github]. The plots in this article were generated using matplotlib.
Thanks so much for reading!
Your opinions are welcome. We love hearing what you think about Magic! We ask that you are always respectful when commenting. Please keep in mind how your comments could be interpreted by others. Personal attacks on our writers or other commenters will not be tolerated. Your comments may be removed if your language could be interpreted as aggressive or disrespectful. You may also be banned from writing further comments.